Debugging JavaScript in Chrome
Code Quality: Debugging in Chrome
Can you explain what debugging is in JavaScript development?
View Answer:
Interview Response: Debugging is finding and fixing errors within a script.
Technical Response: Debugging is finding and fixing errors within a script. Modern browsers and most other environments support debugging tools – a unique UI in developer tools makes debugging much more manageable. It also allows us to trace the code step by step to see what is going on.
What is Chrome Developer Tools, and what features does it offer for debugging JavaScript code?
View Answer:
Interview Response: Developer Tools is a set of web developer tools integrated into Google Chrome, offering features like debugging JavaScript code, performance analysis, DOM manipulation, and network activity monitoring.
How do you turn on/open developer tools in Chrome?
View Answer:
Interview Response: To open Developer Tools in Chrome, you can press F-12 or use the CTRL+Shift I shortcut on Windows/Linux, or you use the Option+Cmd I on MacOS. Alternatively, you can right-click inside the browser window and select inspect.
How can you access the console sidebar in the Chrome developer tools?
View Answer:
Interview Response: You can use the toggle button on the top left side of the console to open and close the vertical tabs in the console sidebar.

What are the three panes accessible via the Chrome Dev Tools source tab?
View Answer:
Interview Response: The file navigator, code editor, and the JavaScript debugging pane, which includes breakpoints, call stack, and scope information.

Where can you find the file navigator pane and open it in the Chrome developer tools?
View Answer:
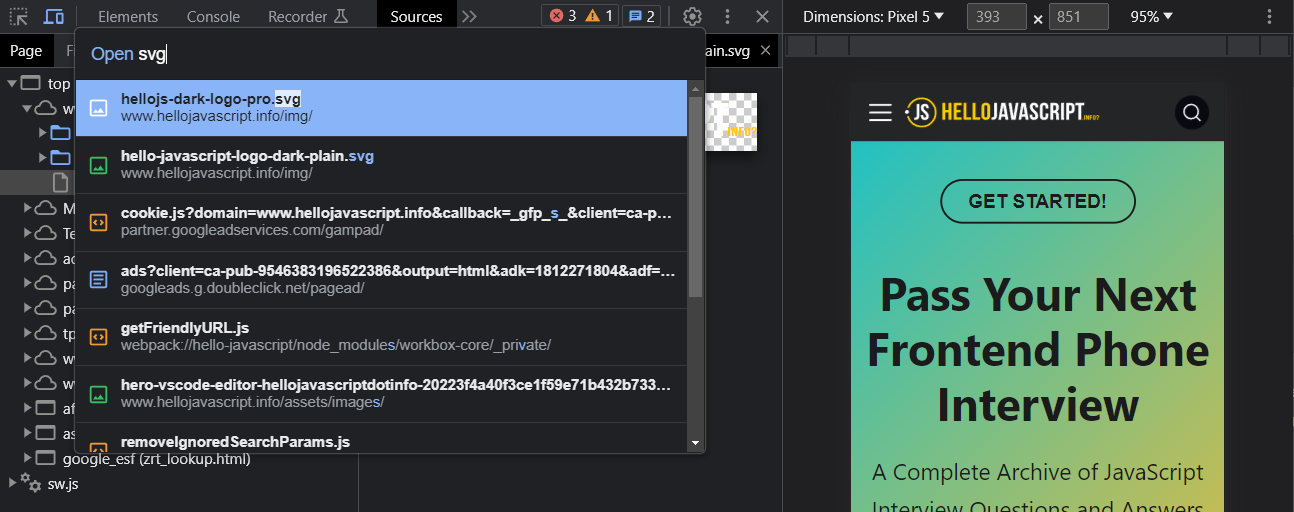
Interview Response: In Chrome Developer Tools, you will find the File Navigator pane in the Sources tab. We can open DevTools by clicking the "Sources" tab, and the File Navigator pane will appear on the left-hand side (It's pane number 1 in the image below).
In Chrome Dev Tools, How do you search for a file in the file navigator?
View Answer:
Interview Response: In Chrome Dev Tools, press Ctrl + P (or Cmd + P on Mac) to open the quick file search and then type the filename.
Where is the JavaScript debugging pane located in the chrome developer tools?
View Answer:
Interview Response: You can find the JavaScript debugging pane on the right-hand side of the code editor, under the sources tab in the Chrome Dev Tools.(It's pane number 3 in the image below).
How can you toggle to enter and escape the console tab window?
View Answer:
Interview Response: You can press the escape (ESC) key, on your keyboard, to toggle the console tab window while in any panel of Chrome Developer Tools.
What are some examples of things you can do with the developer console?
View Answer:
Interview Response: The developer console allows you to execute JavaScript code, modify web page elements, inspect the properties and styles of elements, log debugging information, analyze network activity, and profile the performance of web applications.
What is a breakpoint in JavaScript debugging?
View Answer:
Interview Response: A breakpoint in JavaScript debugging is a point in the code where execution stops, allowing the developer to inspect the state of the program and its variables.
How do you explicitly implement the debugger in most code editors?
View Answer:
Interview Response: To explicitly implement a debugger in most code editors, set breakpoints, launch the debugger, step through code, inspect variables, evaluate expressions, and interact with the call stack. This process varies depending on the specific editor used.
Code Example:
// explicit debugger implementation
function hello(name) {
  let phrase = `Hello, ${name}!`;

  debugger; // <-- the debugger stops here

  say(phrase);
}
How do you reload the source page after setting your breakpoints in the Chrome developer console?
View Answer:
Interview Response: In Windows, you can press F5 to reload the page; you must use Cmd+R on a MAC.
Technical Response: To reload the source page after setting breakpoints in the Chrome Developer Console, you can press the F5 key, click the circular reload button in the top-left corner, use the Cmd+R shortcut, or right-click and select "Reload".
What does the watcher do in the chrome development tools?
View Answer:
Interview Response: In Chrome Developer Tools, the Watcher allows developers to observe and evaluate expressions in real-time during debugging, displaying current values and updating them as code execution progresses.
How do you make a minified file readable in Chrome development tools?
View Answer:
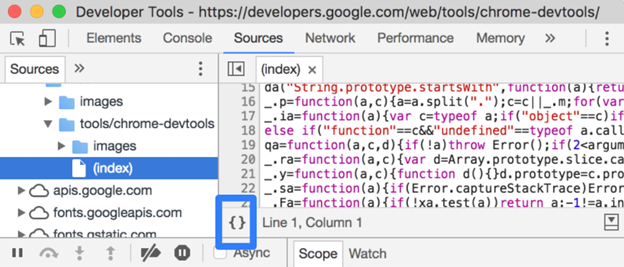
Interview Response: To make a minified file readable in Chrome Developer Tools, you can open the file in the "Sources" tab and click the "Pretty print" curly-brace {} icon at the bottom.
What is the purpose of the Call Stack panel in Chrome Developer Tools?
View Answer:
Interview Response: The Call Stack panel in Chrome Developer Tools displays the sequence of function calls leading to the current execution point, allowing you to navigate and debug through the functions involved in the code execution.

Is the console part of the DOM or the BOM?
View Answer:
Interview Response: The console is part of the Browser Object Model (BOM), not the Document Object Model (DOM). It allows interaction with the browser, not directly with the webpage's document structure.
In web development, why do developers use the source panel?
View Answer:
Interview Response: Developers use the Source panel in web development for debugging JavaScript, setting breakpoints, stepping through code execution, viewing and modifying CSS, examining the DOM, and interacting with source files in a structured manner.
How do you set a breakpoint in Chrome Developer Tools?
View Answer:
Interview Response: To set a breakpoint in Chrome Developer Tools, open DevTools, navigate to the Sources panel, locate the desired JavaScript file, click the line number where you want the breakpoint, and the breakpoint will be added.
What is the process for setting a "conditional" breakpoint in Chrome Developer Tools?
View Answer:
Interview Response: In Chrome Developer Tools, open the Sources panel, find the desired JavaScript file, right-click the line number, where you want the breakpoint, select "Add conditional breakpoint," and enter your conditional expression.
What are some common use cases for breakpoints in JavaScript Development?
View Answer:
Interview Response: Common use cases for breakpoints in JavaScript development include debugging, investigating variable values, understanding code execution flow, identifying logical errors, and examining event listeners or asynchronous operations.
What is the difference between the "watch" and "scope" panels in Chrome Developer Tools, and how can you use them to debug JavaScript code?
View Answer:
Interview Response: The "watch" panel in Chrome Developer Tools allows developers to manually track the value of specific variables or expressions, while the "scope" panel displays the current scope chain and variable values. Both panels can be used to debug JavaScript code by monitoring and changing variable values during runtime.
How can you use the network panel in DevTools to debug code that relies on server-side APIs?
View Answer:
Interview Response: The Network panel in Chrome Developer Tools can be used to monitor and inspect the HTTP requests and responses sent between a web application and its server-side APIs, allowing developers to debug issues related to network connectivity, request and response headers, and data payloads, among other things.
What is the purpose of the Timeline panel in Chrome Developer Tools, and how can you use it to debug JavaScript code?
View Answer:
Interview Response: The Timeline panel in Chrome Developer Tools provides a graphical representation of the performance of a web application, including information about JavaScript execution, rendering, and network activity. It can be used to debug performance issues, such as slow-loading pages, by identifying areas of the code that are causing performance bottlenecks.
How can you use the Memory panel in Chrome Developer Tools to debug memory leaks in JavaScript code?
View Answer:
Interview Response: The Memory panel in Chrome Developer Tools can be used to track the memory usage of a web application and identify potential memory leaks in JavaScript code. Developers can take snapshots and compare them to see which objects and functions are consuming excessive memory and causing leaks.
What are some common JavaScript errors that you may encounter while debugging in Chrome Developer Tools, and how can you resolve them?
View Answer:
Interview Response: Some common JavaScript errors that developers may encounter while debugging in Chrome Developer Tools include undefined variables, null values, syntax errors, and type errors. To resolve them, developers can check their code for correct syntax, use the console to log and investigate the error messages, and use try-catch blocks to handle exceptions.
What is the difference between a watch and a breakpoint in Chrome Developer Tools?
View Answer:
Interview Response: A watch in Chrome Developer Tools allows you to track changes in variables and expressions during code execution, while a breakpoint stops execution at a specific line of code.
How do you check the value of a variable in Chrome Developer Tools?
View Answer:
Interview Response: You can check the value of a variable in Chrome Developer Tools by typing its name in the console or adding it to the watch list.